
Filter by
SubjectRequired
LanguageRequired
The language used throughout the course, in both instruction and assessments.
Learning ProductRequired
LevelRequired
DurationRequired
SkillsRequired
SubtitlesRequired
EducatorRequired
Results for "motion graphics"
 Status: Free
Coursera Project Network
Skills you'll gain: Simulation and Simulation Software, Data Sharing, Mathematical Modeling, Agentic systems, Visualization (Computer Graphics), Environment, Biology

Ball State University
Skills you'll gain: Rmarkdown, Exploratory Data Analysis, Data Visualization Software, Ggplot2, Interactive Data Visualization, Statistical Visualization, Visualization (Computer Graphics), R Programming, Data Storytelling, Data Presentation, Histogram, Scatter Plots, Data Analysis, Data Manipulation

Coursera Project Network
Skills you'll gain: Plotly, Histogram, Interactive Data Visualization, Scatter Plots, Plot (Graphics), Data Visualization, Data Analysis, Python Programming
Coursera Project Network
Skills you'll gain: User Experience, Persona (User Experience), User Interface (UI) Design, User Flows, User Experience Design, Usability, Visualization (Computer Graphics), User Centered Design
 Status: Free Trial
University of California San Diego
Skills you'll gain: Student Engagement, Algorithms, Diversity Awareness, Pedagogy, Facebook, Instructional Strategies, Programming Principles, Student-Centred Learning, Teaching, Data Storage, Education and Training, Software Engineering, Geographic Information Systems, Image Analysis, Classroom Management, Lesson Planning, Computer Science, Theoretical Computer Science, Computational Thinking, Computer Graphics
 Status: Free Trial
University of Colorado Boulder
Skills you'll gain: Systems Engineering, Global Positioning Systems, Control Systems, Engineering, Human Factors, System Testing, Wireless Networks, Automation, Structural Engineering, Thermal Management, Electric Power Systems, Environmental Monitoring
 Status: Free Trial
University of Glasgow
Skills you'll gain: Computational Thinking, JSON, Application Deployment, Data Structures, Javascript, Application Development, HTML and CSS, Data Analysis, Code Review, Software Development, Data Visualization Software, Web Development, Scripting Languages, Scripting, Prototyping, Data Processing, Programming Principles, Unsupervised Learning, Front-End Web Development, Computer Programming

Skills you'll gain: Data Visualization Software, Data Visualization, Data Presentation, Scatter Plots, Plot (Graphics), Box Plots, Exploratory Data Analysis, Histogram, Descriptive Statistics, Heat Maps, Graphing

Coursera Project Network
Skills you'll gain: Matplotlib, Box Plots, Plot (Graphics), Seaborn, Data Visualization, Data Visualization Software, Pandas (Python Package), Scatter Plots, Data Presentation, Data Import/Export, Histogram, Python Programming, Data Manipulation, Data Analysis, Data Structures
 Status: Free Trial
University of Glasgow
Skills you'll gain: Computational Thinking, Javascript, Programming Principles, Computer Programming, Computer Graphics, Animations, Debugging, Scripting Languages
 Status: Free Trial
University of Colorado Boulder
Skills you'll gain: Control Systems, Vibrations, Simulations, Mechanics, Angular, Engineering Analysis, Torque (Physics), Mathematical Modeling, Linear Algebra, Differential Equations, Calculus
 Status: Free Trial
Skills you'll gain: Matplotlib, Plot (Graphics), Data Visualization Software, Data Visualization, Jupyter, Interactive Data Visualization, Scatter Plots, Histogram, Box Plots, Animations, Python Programming
In summary, here are 10 of our most popular motion graphics courses
- Modelo de Ecossistema com Insight Maker: Coursera Project Network
- Data Visualization: Ball State University
- Crash Course on Interactive Data Visualization with Plotly: Coursera Project Network
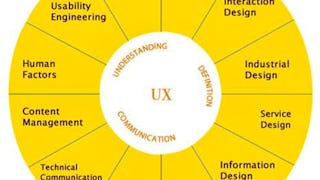
- Get Started with User Experience (UX) Design in Miro: Coursera Project Network
- Teaching Impacts of Technology: Relationships: University of California San Diego
- Getting There and Going Beyond: University of Colorado Boulder
- Computational Thinking with JavaScript: University of Glasgow
- Data Visualization in Stata: Packt
- Plots Creation using Matplotlib Python: Coursera Project Network
- Computational Thinking with Javascript 1: Draw & Animate: University of Glasgow


